


In the last decade, data have multiplied exponentially. Every day, companies, governments and individuals work to manage their data in the best possible way. Thanks to Machine Learning and Artificial Intelligence, the acquisition of valuable data has become one more element in successful strategies.
However, the value of the data that is analyzed in most cases is not high, so the cleaning, cleaning and standardization of data has become 70% of the work of a data scientist. This is mainly due to the complexity of Big Data.
Often, massive amounts of information must be eliminated in order to respond to a particular need. For this, the algorithms applied to the data must make sense in their context, as well as being precise, interpretable and generalizable.
Faced with this situation, Data Analytics tools have become essential. Analytics helps companies in the proper functioning of their daily operations and in obtaining potential results and if this analysis is accompanied by images that simplify this information, the success will be greater.
Effective display of data
The human brain is programmed to react better to visual signals. As a result, visual content is processed much faster and easier compared to written content. In the digital age, where people are inundated with large volumes of data on a daily basis, data visualization allows decision makers to quickly and effectively process raw data to find the most relevant information.
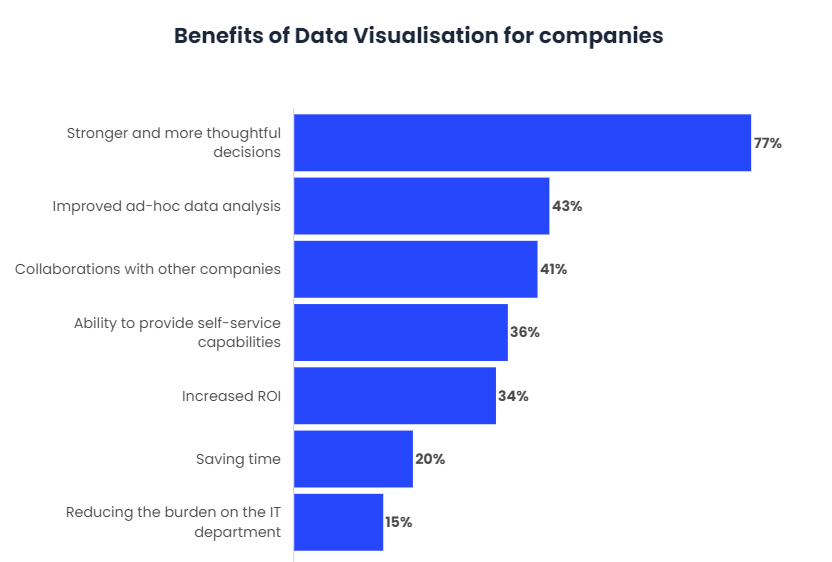
Visual Analytics tools help you interact with data to gain information, knowledge, design conclusion, and make instant but accurate decisions. The virtue of visual representation reduces the complicated work required for a given task. Companies use this tool to generate information and derive information from it, among some of the benefits it can offer:
- Helps turn an overloaded information set into an opportunity.
Developers of business intelligence and data analysis applications are increasingly using advanced technology to handle large volumes of information that helps better interpret analytical results.
Businesses today are being bombarded with large volumes of data, so there is a need to turn them into intelligent business decisions. While most traditional business intelligence tools are geared toward market analysts, data visualization is seen as a way to make business analysis available to a wider audience.
Interactive data visualization tools enable a better understanding of relationships and trends in information sets. A recent study reveals that decision makers who use data visualization tools are 28% more likely to discover relevant information than those who rely almost exclusively on traditional managed reports and simple dashboards. In addition, 48% of employees who use business intelligence along with visual data discovery tools are able to access the data they need without the help of IT staff.
- It allows professionals in the sector to expand their cognitive abilities in the analytical process.
The volume of data companies can collect about customers and market conditions can provide business leaders with information about new revenues and business opportunities. Using data visualization will enable decision makers to understand changes in customer behavior and market conditions in multiple datasets much more efficiently.
Business leaders can use data visualization to see that not only do customers spend more in their stores as macroeconomic conditions improve, but they are also increasingly interested in buying prepared foods, for example. Looking at a customer’s feelings and other data reveals an emerging opportunity for the company to act on new business opportunities before its rivals.
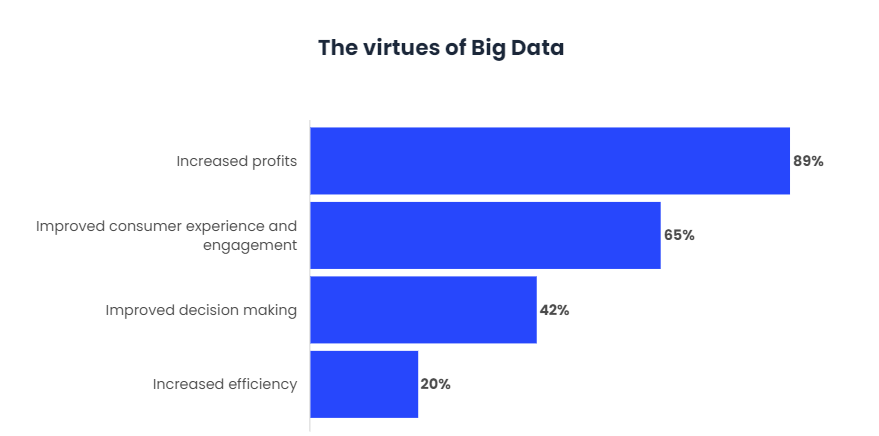
Companies with the most advanced and fully capable analytics are twice as likely to be among the best financial results in their industry. In addition, these companies are five times more likely to make those crucial decisions faster and more effectively than their competitors.
- The tools are used for applications that include complex and large datasets along analytical processes that require excessive monitoring and interaction.
Most business reports are formal documents, full of tables and static graphics. Comprehensive as these reports may be, they become so complex that most of the information is lost or fails to attract the attention of the people whose opinions are most important.
On the other hand, reports generated from Big Data’s visualization tools make relevant information more vibrant and memorable for executives. So these tools allow users to encapsulate otherwise complex data and make it more enjoyable for executives and business managers.
Through graphics, decision makers can easily interpret large amounts of data from various sources through interactive elements and constructive visual tools, such as fever graphs and heat maps, to name a few.
- Decision makers will be able to adopt new skills that enable them to use advanced computational tools to improve the discovery process.
Another scope of data visualization that has emerged in the business world lately is geospatial visualization. The popularity of geospatial visualization has occurred due to the large number of companies offering web services, which attracts the interest of visitors.
This type of business needs to take advantage of location-specific information, which is already present in the system in the form of the customer’s zip code, for example, providing a better daily analysis experience. This type of visualization adds a new dimension to the figures and helps to better understand the issue.
Not without challenges
Like many modern tools, data visualization is not without its challenges:
- The tools display graphics, but they don’t explain, sometimes assuming users understand more than they actually do.
- Different users can draw different conclusions.
- Implicit bias of who manages the data, no matter how small.
- A false sense of security: sometimes the graphics are not enough to tell the whole story and this option is not always taken into account.
However, having these small challenges during any data visualization project can help minimize its impact.
A booming market
Despite the specific purposes and the multitude of areas in which it can be used, the visual analysis tool has a great goal to achieve: To deliver information in a way that is understandable to people and that they can easily analyse and act on.
Bearing in mind that emerging technologies influence between 70% and 80% of the income of large companies, it is remarkable that for example large financial services companies have already adopted these tools to closely monitor the destination of money.
This change of mentality is due to the fact that companies can apply the Big Data analysis visualization to almost any area of their business, from marketing to supply chain and customer service, to improve results and optimize their business.
However, the power of analytics can only be realized effectively if people are hired who can understand and use the analysis tools to their full potential.
The global Visual Analytics market is expected to grow at an annual rate of 20.4% by 2022 to $6.51 billion. As a relatively new tool, the latest studies affirm that SAS Analytics skills are the most sought-after skills in today’s labor market.
As a result, there is a great demand for SAS analysis professionals in today’s market. More and more companies are moving towards it, due to its transparent interface and visual representation. As a result, obtaining a SAS visual analysis certification is an excellent way to find a well paid and challenging job.
Conclusions
In today’s world, where everything is digitally recorded, from web browsing patterns to medical records, petabytes of data are being generated and processed every day.
Big data will be decisive in all spheres of life. However, just to process and analyze such data is not enough, the human brain tends to find patterns more efficiently when the data is represented visually. The visualization and analysis of data plays an important role in decision making in various sectors.
It also leads to new opportunities in the visualization domain that represent the innovative idea to solve the Big Data problem through visual media. It is quite a challenge to visualize such an enormous amount of data in real time or in static form.
Against this backdrop, it’s important for companies to look for tools that allow them to immediately begin working with the data to create visual analysis and gain value from the data more easily.


